반응형
Multivariate Time Series Visualization
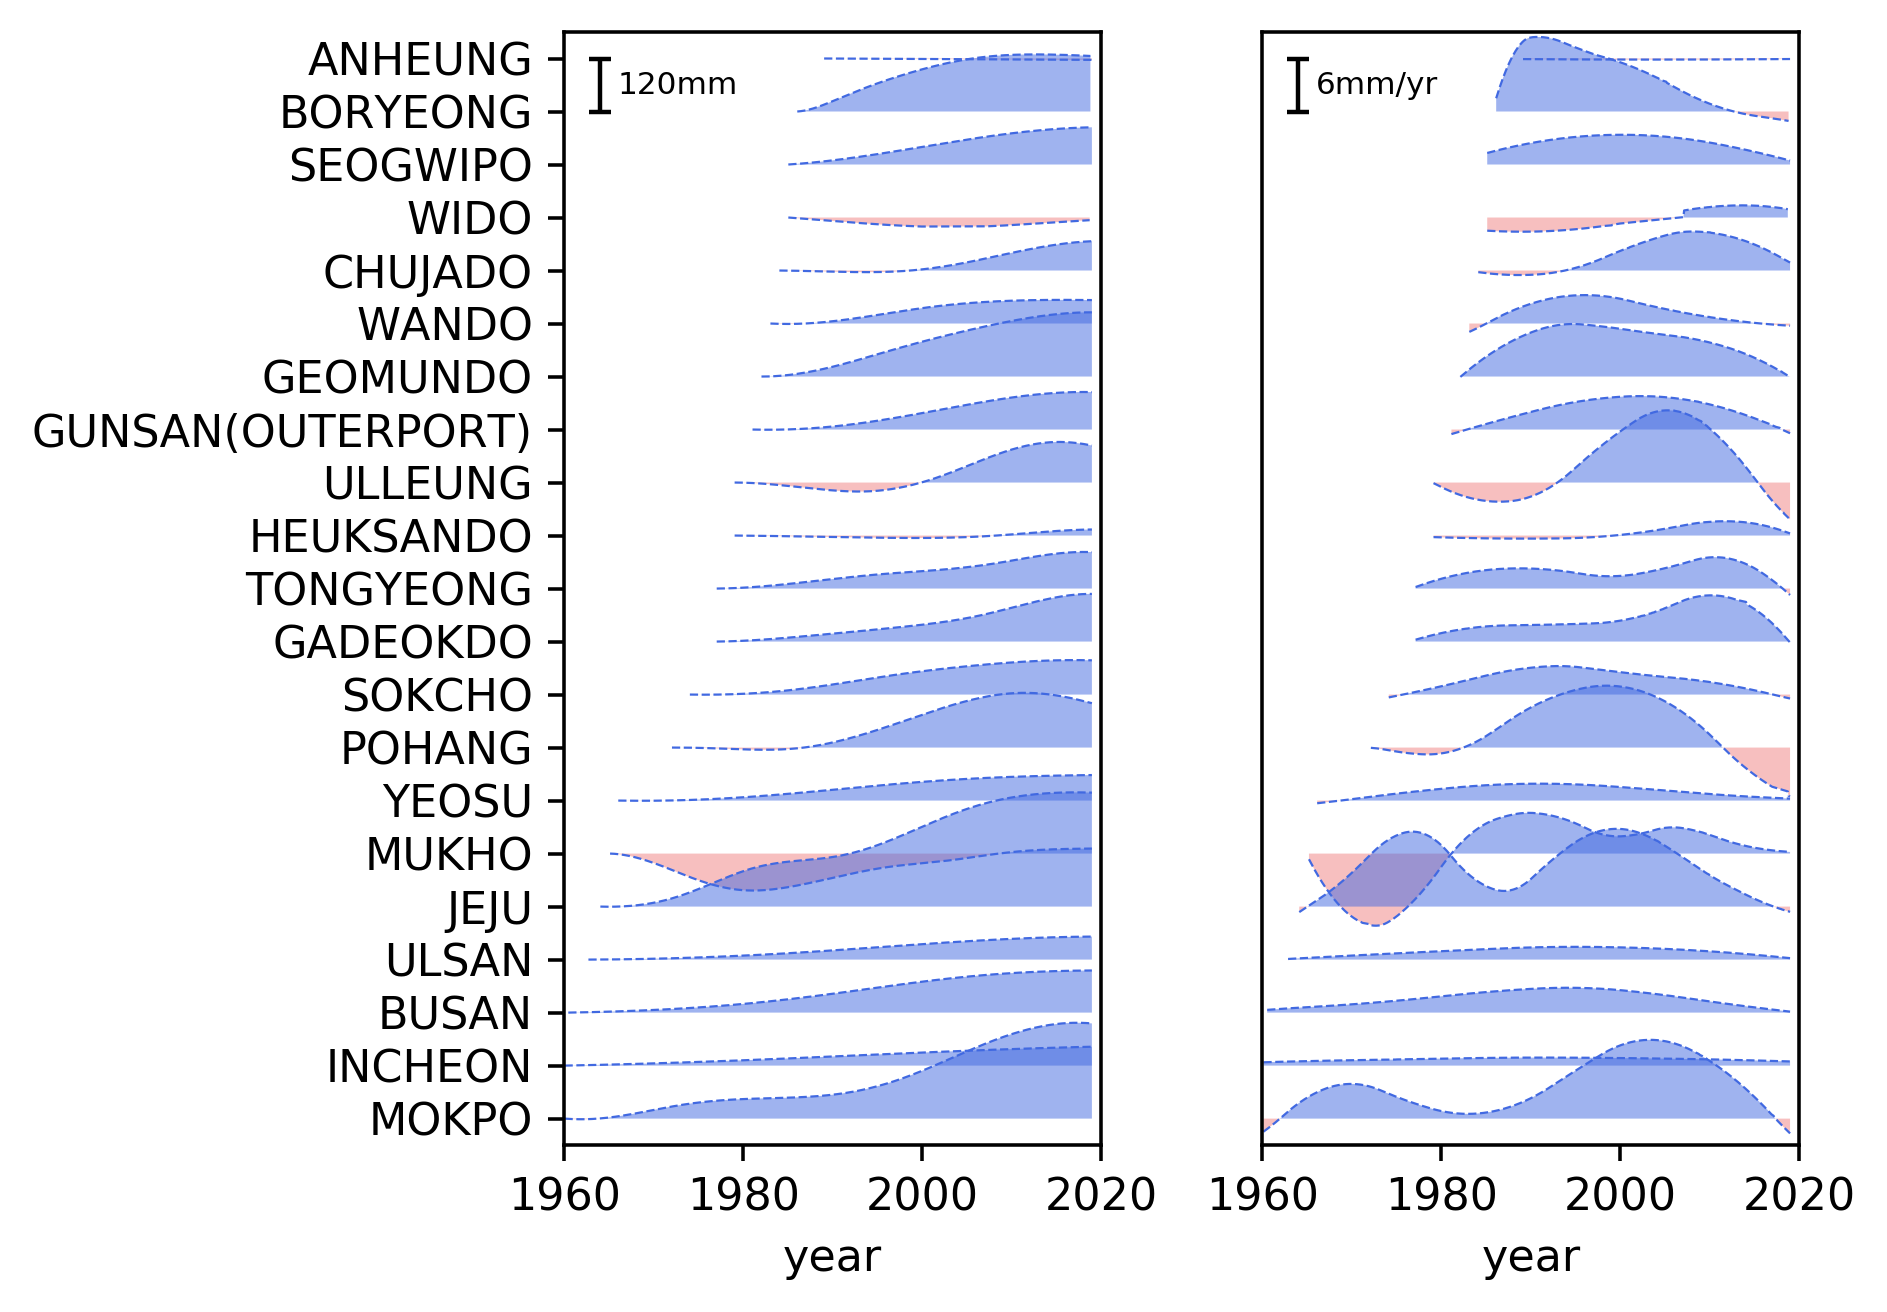
선형 그래프가 많이 있을 때, 이를 시각화 하는건 여러가지 방법이 있겠지만.... 고민 끝에 아래와 같은 그래프를 얻었다....!!!!!!
나와 같은 고민이 있는 분들이 참고하면 좋겠다.
그롬이만
Graph
- 그래프 변천사

- 최종 그래프

Code
############ CONSTANT ############
CONST\_MAX\_GRAPH = sum(\[len(tsC\[x\]) > min\_len for x in range(len(tsC))\])
CONST\_ZOOM\_RATIO = .1
C1 = 'royalblue'
C2 = 'lightcoral'
C3 = 'black'
alp = .5

fig = plt.figure(figsize=(6,.2_CONST\_MAX\_GRAPH),tight\_layout=True, dpi=220)
spec = gridspec.GridSpec(nrows=1, ncols=2, figure=fig)
axes = \[\] # row, col
min\_len = (12_20)

############ Plotting ############
diff = 120
diff2 = 6
i = 0
ax1 = fig.add\_subplot(spec\[0,0\]) # raw, col
ax2 = fig.add\_subplot(spec\[0,1\])
axes = \[ax1, ax2\]
for ii in range(len(tsC)):
if len(tsC\[ii\]) > min\_len:
\_x, \_y = tsC\[ii\], ysC\[ii\]
**y = \_y - diff_i
\_\_y0 = -diff_i
ax1.plot(\_x, \_\_y, label = cols\_CE\[ii\]\[:-8\], c=C1, lw=.5, ls='--')
\_fil1 = ax1.fill\_between(\_x, \_\_y, \_\_y0, where=(**y > **y0), alpha=alp, color=C1, interpolate=True)
\_fil1.set\_edgecolor("none")
\_fil2 = ax1.fill\_between(\_x, \_\_y, \_\_y0, where=(**y < \_\_y0), alpha=alp, color=C2, interpolate=True)
\_fil2.set\_edgecolor("none")
h\_min, h\_max = find\_min\_max(\_x, h\_min, h\_max)

_x, _y = derivate(_x, _y)
__y = _y - diff2*i
__y0 = -diff2*i
ax2.plot(_x, __y, label = cols_CE[ii][:-8], c=C1, lw=.5, ls='--')
_fil3 = ax2.fill_between(_x, __y, __y0, where=(__y > __y0), alpha=alp, color=C1, interpolate=True)
_fil3.set_edgecolor("none")
_fil4 = ax2.fill_between(_x, __y, __y0, where=(__y < __y0), alpha=alp, color=C2, interpolate=True)
_fil4.set_edgecolor("none")
i+=1

############ Scale Bar ############
CONST\_SCALE = 1
pos\_x = 1964
dx = 2
ax1.errorbar(pos\_x,-diff_.5, diff_.5, capsize=2.5_CONST\_SCALE, elinewidth=1_CONST\_SCALE, capthick=1_CONST\_SCALE, c=C3)
ax1.text(pos\_x+dx,-diff_.5,'%dmm'%diff, ha='left', va='center', fontsize = 7)
ax2.errorbar(pos\_x,-diff2_.5, diff2_.5, capsize=2.5_CONST\_SCALE, elinewidth=1_CONST\_SCALE, capthick=1_CONST\_SCALE, c=C3)
ax2.text(pos\_x+dx,-diff2_.5,'%dmm/yr'%diff2, ha='left', va='center', fontsize = 7)

###### Set Limits and Ticks
ax1.set\_ylim(\[-diff_(i-.5),diff/2\])
ax2.set\_ylim(\[-diff2_(i-.5),diff2/2\])
ax1.set\_xlim(\[1960,2020\])
ax1.set\_xticks(np.arange(1960,2021, 20))
ax2.set\_xlim(\[1960,2020\])
ax2.set\_xticks(np.arange(1960,2021, 20))

\_ = ax1.set\_yticks(np.arange(0,-diff\*i, -diff))
\_ = ax2.set\_yticks(\[\])
\_ = ax1.set\_yticklabels(\[x\[:-8\] for x in cols\_CE\])

############ Set Labels and Title ############
ax1.set\_xlabel('year')
ax2.set\_xlabel('year')

plt.savefig('Fig\_SLR\_Stations.png', format='png', dpi=320, bbox\_inches='tight')
반응형
'Programing Language > Python' 카테고리의 다른 글
| [PyQt5] module 'enum' has no attribute 'IntFlag' (0) | 2021.01.27 |
|---|---|
| [visualization] Correlation visualization on a geoplot (0) | 2021.01.08 |
| [datetime] datetime to yearly float (0) | 2020.06.04 |
| [visualization]netCDF 관련 지구 시각화 (2) | 2020.06.02 |
| [plot]LineCollection: edges(끈킨 선 여러개)를 빨리 그릴 때!? (0) | 2020.05.12 |

