반응형
Summary
- 내가 아카이빙용으로 그린거라 설명이 자세하지 않을 수 있음
- PDF, CDF, CCDF를 그리는데 numpy.histogram으로 그리면 매번 귀찮은 점이 있어 코드를 작성
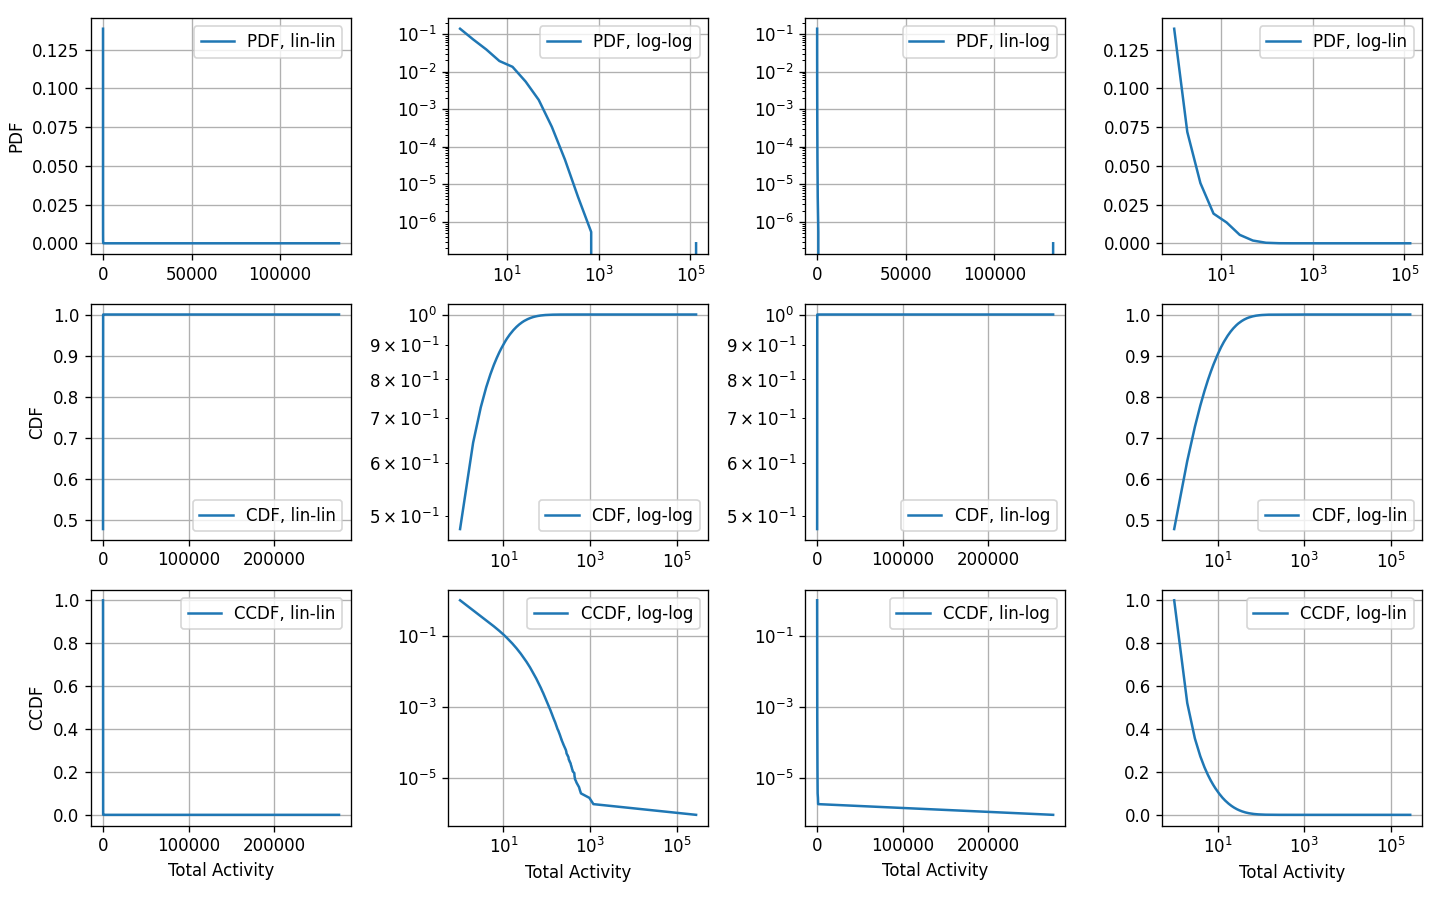
- 데이터가 fat-tail을 가지고 있다면,
log binning을 해야함- log binning을 할 때, 양수가 아니라면 문제가 발생할 수 있어 임의로 masking을 하도록 작성
log binning을 할 경우 _bin size_에 따라 분포 형태 (기울기)가 다르게 보일 수 있음- 이런 경우 CDF를 보면 됨
- 추가적으로 fat-tail을 보고싶다면 CCDF를 보면 됨
Example plot
Code
def hist(x, nbin=50, log= True, kind = 'CCDF', approx = True):
    """
    :)
    """
    if kind == 'PDF':
        _min = x.min()
        _max = x.max()
        if log:
            msk = x > 0
            neg_x = ~msk.sum()
            if neg_x >0:
                print('There is some negative values (n=%d)'%neg_x)
                x = x[msk]
            _min = np.log10(_min)
            _max = np.log10(_max)
            bins = np.logspace(_min,_max,nbin)
        else:
            bins = np.linspace(_min,_max,nbin)

        widths = bins[1:] - bins[:-1]
        hist, e = np.histogram(x, bins, normed=True)
        return widths, hist

    if kind == 'CDF':

        if approx:
            sorted_vals = np.sort(x)
            cdf = np.linspace(1./len(x),1, len(x))
            return  sorted_vals, cdf
        else:
            sorted_vals = np.sort(np.unique(x))
            cdf = np.zeros(len(sorted_vals))
            n = float(len(x))
            for i, val in enumerate(sorted_vals):
                cdf[i] = np.sum(x <= val)/n
            return  sorted_vals, cdf

    if kind == 'CCDF':
        if approx:
            sorted_vals = np.sort(x)
            ccdf = np.linspace(1, 1./len(x), len(x))
            return sorted_vals, ccdf
        else:
            sorted_vals = np.sort(np.unique(x))
            ccdf = np.zeros(len(sorted_vals))
            n = float(len(x))
            for i, val in enumerate(sorted_vals):
                ccdf[i] = np.sum(x >= val)/n
            return  sorted_vals, ccdf
    else:
        print('Wrong kind!')

def set_scale(ax, kind='lin-lin'):
    kind = kind.replace('lin','linear').split('-')
    ax.set_xscale(kind[0])
    ax.set_yscale(kind[1])


N_BIN = 20
kind1 = ['PDF', 'CDF', 'CCDF']
kind2 = ['lin-lin', 'log-log', 'lin-log', 'log-lin']
N_ROW = len(kind1)
N_COL = len(kind2)

fig = plt.figure(figsize = (3*N_COL,2.5*N_ROW), dpi=120, tight_layout=True)
spec = gridspec.GridSpec(ncols=N_COL, nrows=N_ROW, figure=fig)
axes = []

for i, kind in enumerate(kind1):
    a, b = hist(df_temp2.values, N_BIN, kind=kind, approx=False)
    for j, scl in enumerate(kind2):
        idx = i*N_ROW+j
        ax = fig.add_subplot(spec[i, j]) # row, col
        plt.plot(a, b, label = kind+', '+scl)
        set_scale(ax, scl)
        plt.legend()
        plt.grid()
        if i==N_ROW-1:
            plt.xlabel('Total Activity')
        if j==0:
            plt.ylabel(kind)
plt.savefig('Figures/Activity_distribution_20210305.png', format='png')
반응형
'Programing Language > Python' 카테고리의 다른 글
| [Archiving] 파이썬 문법 꿀팁 100선 (0) | 2021.05.11 |
|---|---|
| [JupyterLab] 필수 업데이트!!! 3.0.12 관련사항 (0) | 2021.03.24 |
| [PyQt5] module 'enum' has no attribute 'IntFlag' (0) | 2021.01.27 |
| [visualization] Correlation visualization on a geoplot (0) | 2021.01.08 |
| [visualization]Multivariate Time Series Visualization (0) | 2020.12.17 |
